
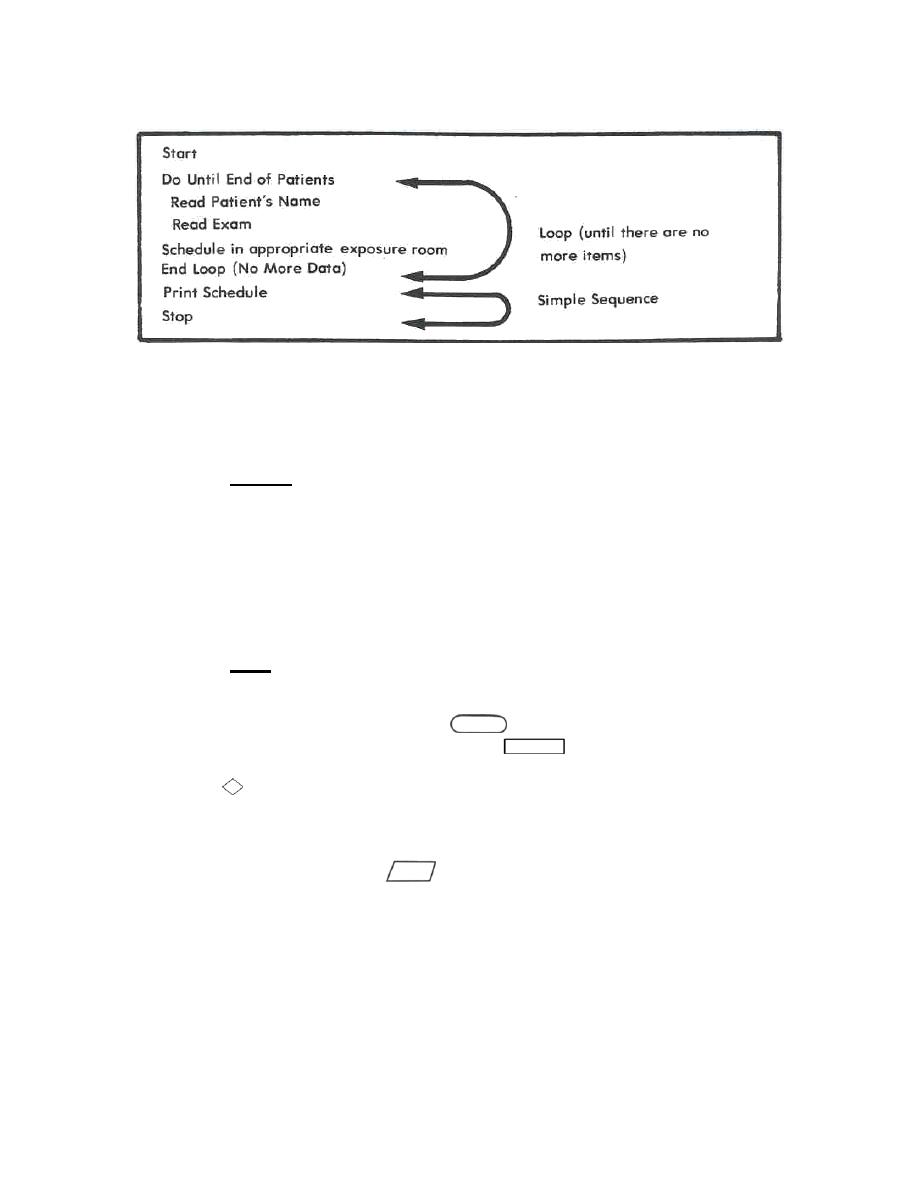
Figure 2-6. This pseudocode provides a narrative description of the processing
steps for patient scheduling.
c. Flowchart.
(1) Defined. The flowchart is another device used to avoid design errors or
omissions. Also known as a block or logic diagram, a flowchart represents the
processing steps in visual form. It uses the English-like statements of the pseudocode
and easily recognizable symbols in the same sequence in which they will occur in the
program.
flowchart: a graphic representation of the processing that is performed in a
program.
(2) Uses. A flowchart can be a useful working document for tracking the
evolution of a program and for updating. To enhance readability, standard ANSI
(American National Standards Institute) flowchart symbols are used. The start or stop
of a program is represented by the symbol
. A process step (addition,
subtraction, and so forth) is shown by the symbol
. This symbol will occur
frequently in a flowchart because most data manipulation involves some kind of
process. The
symbolizes a comparison or decision, a program statement that directs
the computer to compare values. At a decision step, the computer may take one of two
paths (represented by two exit lines leaving the decision block). If the result of the
comparison is true, one path is executed. (See figure 2-9.) If the result is false, the
other is taken. Finally, the symbol
indicates that the program requires either
input or output of data. A list of ANSI flowchart symbols is shown in figure 2-8.
MD0058
2-6

 Previous Page
