
e. Temperature. Enter the temperature symbol in the appropriate location in
the time column. Connect the temperature symbols with a solid line to form a graph.
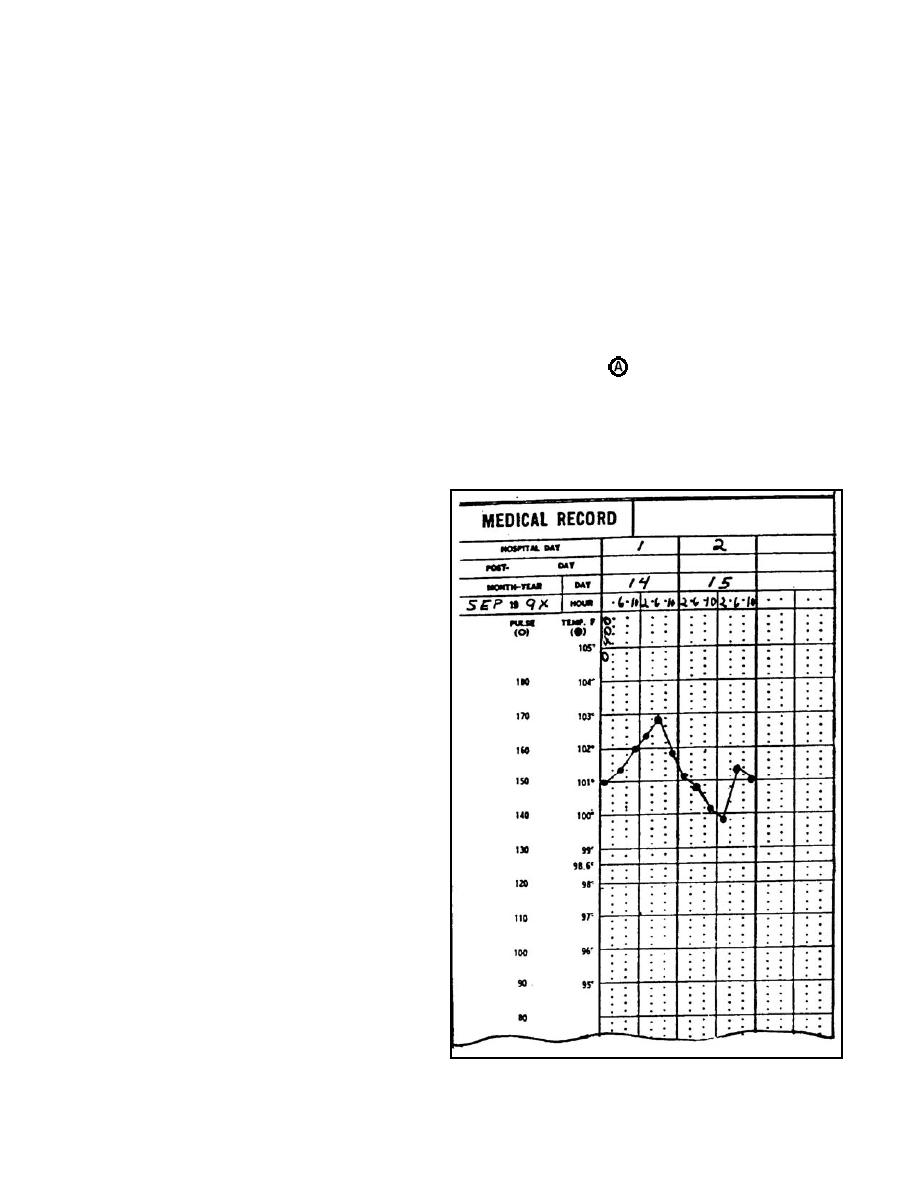
(1) The symbol used in graphing temperature readings is a large dot or
filled-in circle (●).
(2) Use the scale to the right of the pulse scale to graph the patient's
temperature in degrees Fahrenheit. The interval between two solid horizontal lines is
equal to one degree Fahrenheit (1.0F). Therefore, the distance between two dots is
equal to two-tenths of a degree Fahrenheit (0.2F). By convention, temperature
readings are recorded to the nearest two-tenths of a degree. A patient's temperature is
usually taken orally. If the temperature is taken using either the axillary (under the arm)
or rectal method, enter a circled R () for rectal or a circled A ( ) for axillary next to the
graphed symbol on the SF 511. No special symbol is needed for oral temperature
readings. Sergeant Jones' oral temperature readings and an illustration of how they
were charted are shown below.
14 SEP 9X
ADMISSION (0400) ..... 101.0o
0600 ............................. 101.4o
1000 ............................. 102.0o
1400 ............................. 102.4o
1800 ............................. 102.8o
2200 ............................. 101.8o
15 SEP 9X
0200 ............................. 101.2o
0600 ............................. 100.8o
1000 ............................. 100.2o
1400 ............................. 99.8o
1800 ............................. 101.4o
2200 ............................. 101.0o
NOTE: The average normal body
temperature, 98.6F, is indicated by a
solid horizontal line.
The patient's temperature in degrees
Celsius (C) can be determined using the
"Temp C" scale on the far right of the
form (see figure 1-7). For example, the
average normal body temperature is
37C. Read Celsius temperature to the
nearest tenth of a degree (0.1C).
MD0920
1-23

 Previous Page
