
(b) Both sides of the SF 511 are the same. When the front of the form
is filled (such as a patient whose hospital stay is longer than seven days), the reverse
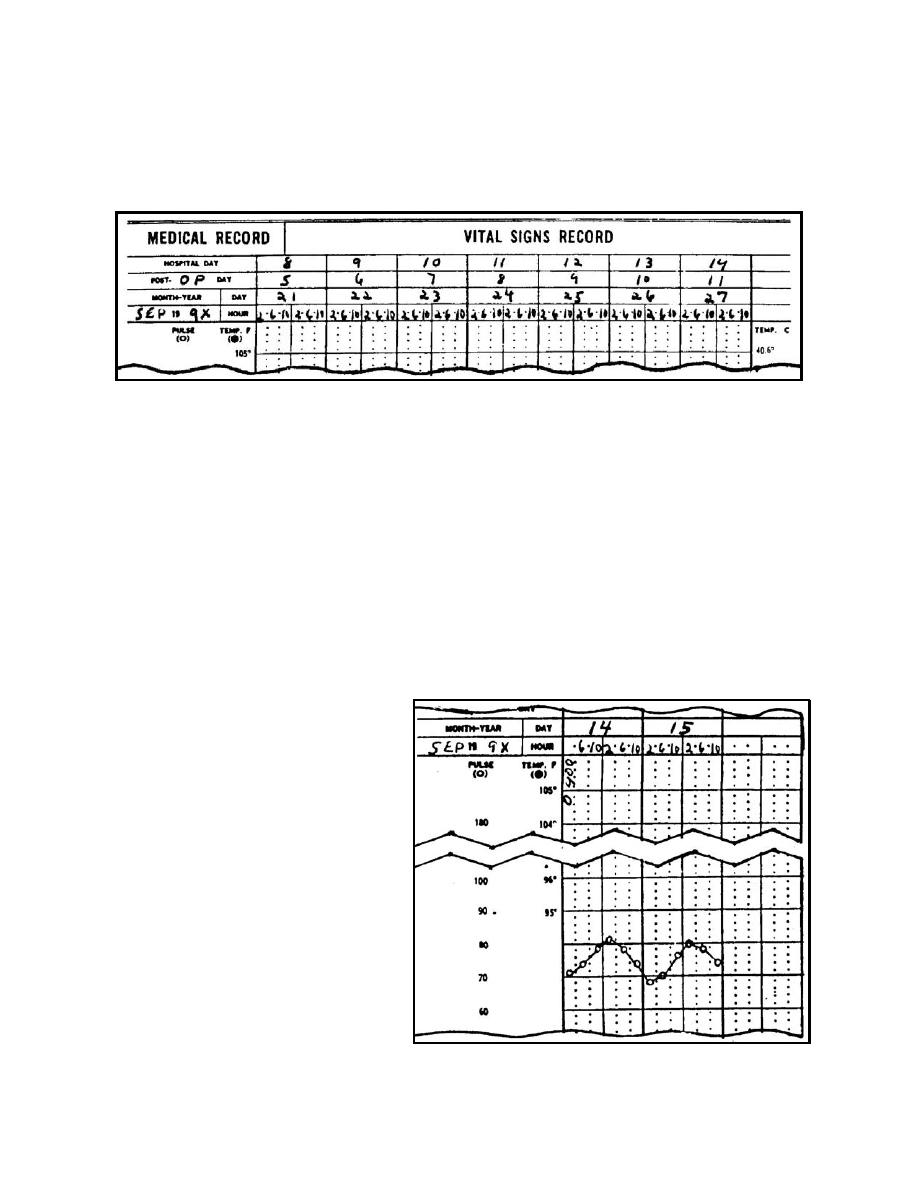
side of the form is used. The numbering of the rows is continued consecutively. The
reverse side of Sergeant Jones' TPR graphic would appear as follows:
c. Pulse Rate. Enter the pulse symbol in the appropriate location in the time
column. Connect the pulse symbols with a solid line to form a graph.
(1)
The symbol used to graph the pulse rate is an open circle (o).
(2) There are two scales located along the left side of the SF 511. Use the
scale under the word "PULSE" to graph the patient's pulse rate and blood pressure
readings. Four dots lie vertically between the solid horizontal lines. Since the pulse
scale indicates that the interval between the solid horizontal lines is 10 (a change in
pulse rate of 10 beats per minute), then the distance between two dots represents two
whole numbers (a change in pulse rate of two beats per minute). By convention, pulse
rates are recorded in even whole numbers. Sergeant Jones' pulse rates and an
illustration of how they were graphed on his SF 511 are shown below.
14 SEP 9X
ADMISSION (0400) ..... 72
0600 ............................. 74
1000 ............................. 78
1400 ............................. 82
1800 ............................. 78
2200 ............................. 74
15 SEP 9X
0200 ............................. 68
0600 ............................. 70
1000 ............................. 76
1400 ............................. 80
1800 ............................. 78
2200 ............................. 74
MD0920
1-21

 Previous Page
